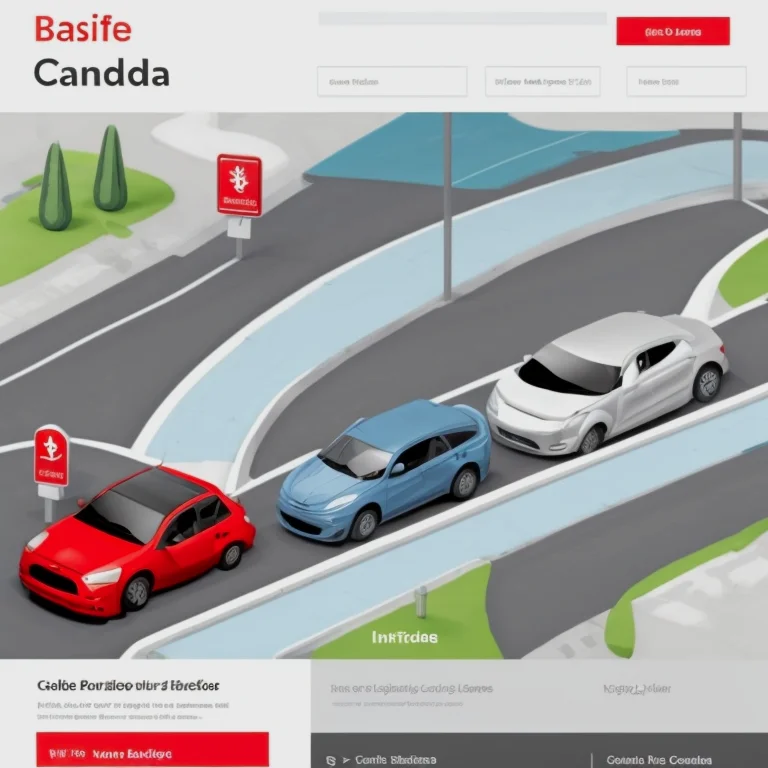
Scenario-first comparison model

Our business model: scenario-based insurance comparison

Data collection and normalization

We gather rate tables, standard policy language and endorsements from licensed insurers across Canadian provinces. Data normalization aligns different naming conventions (for example, how optional coverages are labeled) so policies can be compared on uniform dimensions: liability limits, collision and comprehensive deductibles, uninsured motorist coverage, and common endorsements.

Example: When two carriers label similar coverages differently, we map both to a standard field so a commuter profile sees apples-to-apples comparisons rather than being misled by naming variance.

Scenario design and assumptions

Scenarios reflect typical driving profiles and edge cases: daily commuters with winter exposure, multi-car families with teenage drivers, part-time drivers, and small business vehicle use. Each scenario includes assumptions for annual mileage, primary location, likely claim frequency, and seasonal risk factors.

  • Commuter: 8,000–12,000 km/yr, urban driving
  • Family: two vehicles, one new driver, mixed usage
  • Rural seasonal driver: low annual km, higher exposure to wildlife and winter hazards

These assumptions appear in every comparison so users can see how the same policy performs across different realistic use patterns.

Policy mapping and comparison

After mapping policy features to standard fields, we run side-by-side comparisons that highlight differences in premium, deductible impact, and claim handling clauses such as rental vehicle reimbursement and accident forgiveness.

Practical example: For a 30-year-old commuter, Carrier A's lower premium but higher collision deductible produced similar total expected outlay over three years compared with Carrier B's higher premium and lower deductible once two minor collisions were modeled.

We publish the scenario inputs and the resulting calculations so users can adjust assumptions and see new outcomes.

Claim simulations and cost modeling

Claim simulations model a plausible sequence of events: incident, claim submission, payment minus deductible, and premium adjustments over subsequent renewal cycles. We show both one-time incident costs and multi-year premium impacts.

Example simulation: A single at-fault fender-bender with a $1,000 deductible and $3,200 repair cost leads to an immediate out-of-pocket of $1,000 plus incremental premium changes estimated over 2–3 renewals to reflect typical underwriting adjustments.

No unrealistic projections

We avoid optimistic projections of saving amounts and instead present ranges based on historical claim frequency and insurer behavior patterns.

Presenting outcomes and activity-offs

Comparisons present headline premium, deductible scenarios, and a short 'what happens if' claim outcome for each policy. This helps users weigh short-term premium savings against potential long-term costs after claims.

Each result page includes an annotated checklist: coverage gaps to watch, endorsements worth considering for the profile, and a plain-language summary of potential shortfalls.

Ongoing updates and provincial changes

We update our data when provincial regulations change or carriers alter standard endorsements. Updates are scheduled and recorded so users can see when scenario inputs were last refreshed.

  • Quarterly data refresh cycle plus immediate updates for regulatory changes
  • Case study: Urban commuter in Toronto switched from a standard policy to a multi-quote package after comparing three insurers on tryautopulsespot. The scenario showed different deductible strategies and optional coverage mixes, illustrating activity-offs between premium reductions and out-of-pocket exposure during claims.
  • Scenario: Young driver in British Columbia compared usage-based and traditional policies. The step-by-step comparison on tryautopulsespot highlighted how telematics programs affect rates based on driving patterns, with practical examples showing when telematics delivers value and when a conventional policy may be more predictable.

In practice, our third-party comparisons focus on actionable scenarios: commuters, long-distance drivers, occasional city drivers and families with multiple vehicles. Each example breaks down coverages, deductibles and optional protections, showing real-world consequences for claim costs, repair scopes and liability exposure. These case-based comparisons help users make decisions aligned with their driving profile and budget constraints.

User privacy and data handling

When building a comparison, tryautopulsespot uses scenario templates derived from actual customer profiles: age, driving history, vehicle type, annual kilometers and primary use. For each template we present a side-by-side summary of premium, key coverages, and claim-handling notes drawn from insurer policy wording and publicly available performance indicators.

We illustrate differences with concrete examples: how a $500 deductible affects total out-of-pocket cost after a collision, or how limited rental-car coverage changes the net expense of a repair delay. These examples are accompanied by checklists so consumers can match a policy’s practical implications to their own likely claim scenarios.

Contact tryautopulsespot

For business inquiries, data partnership requests, or feedback about our comparison tools, contact the tryautopulsespot team. Provide a brief description of your request and preferred times for follow-up. We respond with specific next steps and, where applicable, examples of previous comparison integrations or white-label deployments.

  • [email protected]
  • +14167025060
  • 235 3 Street West, Cornwall ON K6J 0B6, Canada
  • 253176041
Business contact — tryautopulsespot